Calculating the impact of HUD’s homeless formulas, old and new
By Austin FastHoward Center for Investigative Journalism
When Congress passed the Coronavirus Aid, Relief, and Economic Security Act in March, it included $4 billion in homeless aid through the Emergency Solutions Grant program run by the Department of Housing and Urban Development. HUD since 1987 had calculated the amount of homeless aid communities received based on a formula that was unrelated to homelessness. Since the pandemic grant program was so large, Congress told HUD to recalculate its formula to reflect an area’s homelessness. That “new” formula was used to allocate the second round of ESG funding, nearly $3 billion, in June 2020 and dramatically reshaped where dollars went nationwide.
The Howard Center for Investigative Journalism decided to see how much money each city, county and state recipient would have gotten to care for their homeless residents over the last decade had HUD used this better-targeted formula starting in 2011 instead of 2020.
The new formula considers four variables for each community:
- Share of all homeless people from the previous year’s homeless census (50% weight)
- Share of unsheltered homeless people from the previous year’s homeless census (10% weight)
- Share of those at risk for homelessness, calculated using the total number of very low-income renter households for a community. HUD usually defines very low-income renters as those who earn less than 50% of the area’s median family income. (15% weight)
- Share of those at risk for unsheltered homelessness, calculated using the total number of very low-income renters who are living in overcrowded situations (more than one person per room) or in housing without a complete kitchen or plumbing. (25% weight)
Factoring homeless counts into existing aid program
The numbers of total homeless people and unsheltered homeless people come from the previous year’s Point-in-Time, or PIT, counts, conducted by local HUD-approved bodies that oversee homeless services for a given area. Because the geographic areas covered by these PIT counts often differ from the geographic areas that HUD used to allocate ESG funding, the department had to adjust for those boundary differences in order to calculate payouts under the new formula.
They took the grant recipient boundaries of the existing Community Development Block Grant program and overlaid the respective counts from the previous year’s homeless census to come up with a new way of calculating the pandemic payouts of the ESG program.
Of the approximately 4,100 city and county participants in the 2019 block grant program, HUD determined that only 307 would be eligible for direct homeless assistance under the new formula – the same recipients that received direct aid in 2020’s regular allocation. The remainder would get their emergency homeless aid via federal payments to the states. HUD based its calculations on 2019 data and used them to assign homeless counts for the one-time CARES Act payout.
To see how much money communities would have received if HUD had used the homeless-centered CARES Act formula yearly, the Howard Center followed the department’s methodology for the pandemic payouts and applied it to the years 2011 to 2019. It did that with the help of a third HUD formula, which is based on the community development block grant calculation that HUD uses in the ESG program to determine the amount of an area’s homeless assistance. Using this third formula, which HUD makes public, allowed the Howard Center to create a “crosswalk” for each of the past 10 years to apply actual homeless counts to the existing ESG grant recipient areas.
This process produced a nearly identical crosswalk to the one HUD used in calculating its 2020 pandemic payouts. The Howard Center checked its use of the third formula in assigning homeless counts to grant areas for 2020 with HUD’s actual crosswalk, which the department provided, and the average difference was just 0.006%.
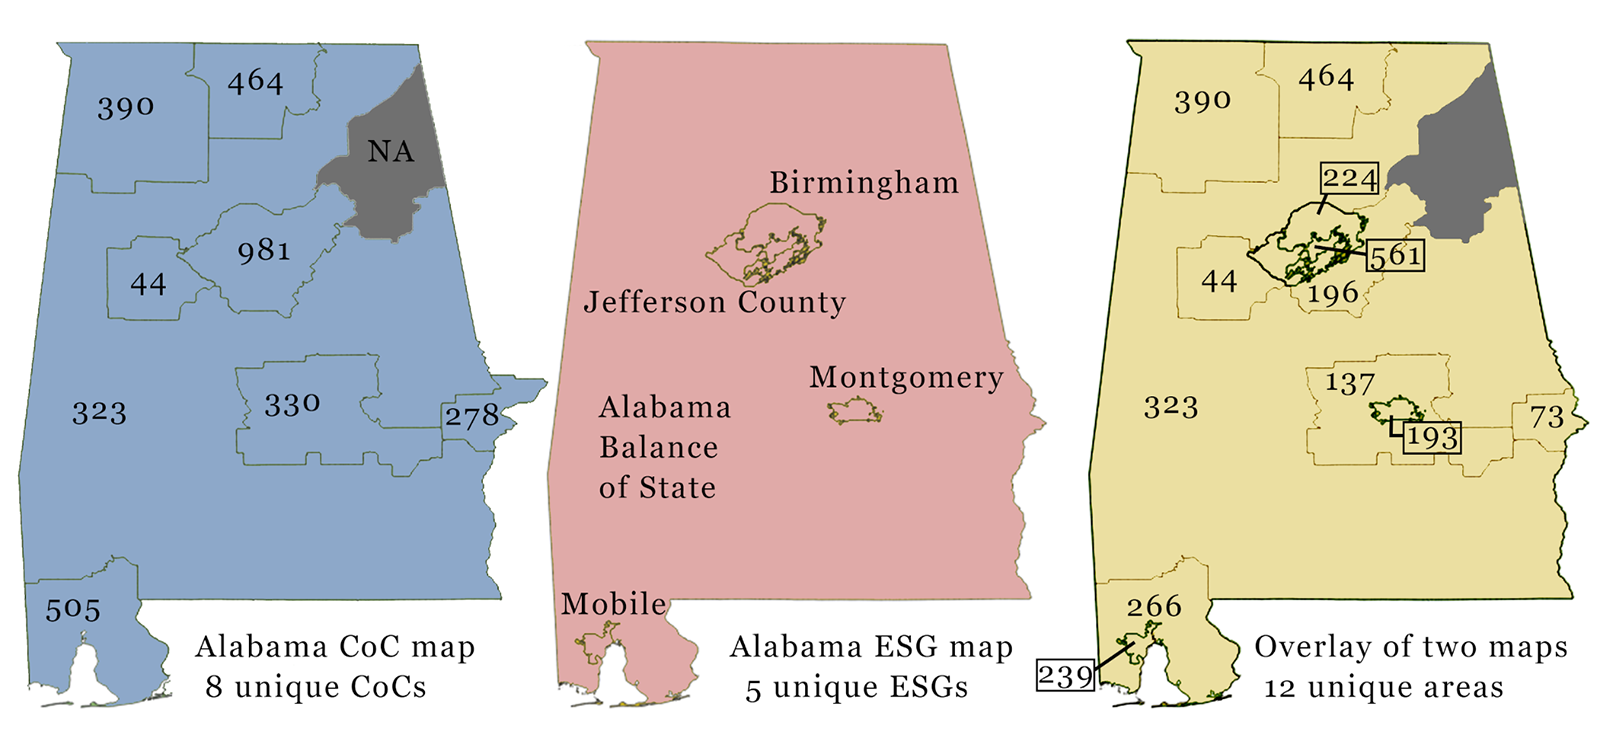
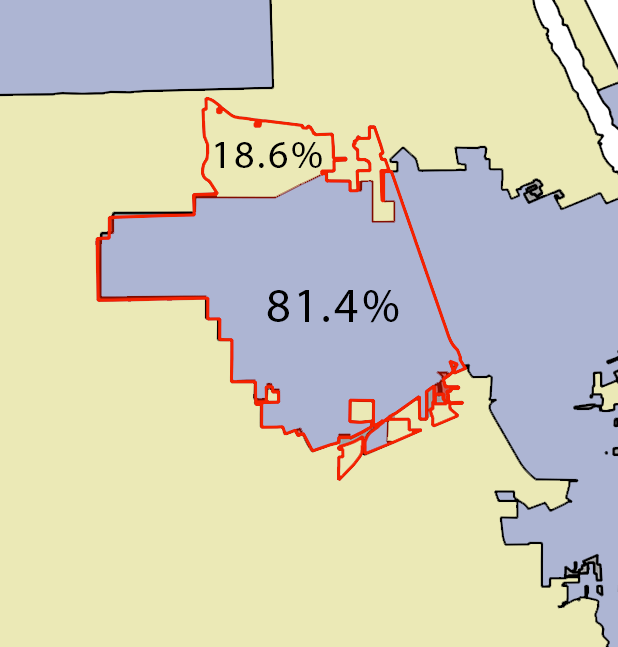
Studying Alabama helps visualize this process. Homeless counts are seen in the blue map for the eight Continuums of Care, HUD-approved entities that administer homeless services. But HUD disburses homeless grants in its ESG program based on the five areas shown on the red map. The crosswalk necessary to calculate the 2020 CARES Act payout created a unique combination of the two geographies, shown in the yellow map. The Birmingham metro area counted 981 homeless people in 2019. The crosswalk allocates 57% of that total homeless count, or 561 people, to the Birmingham city ESG payment area; 23%, or 224 people, to the Jefferson County ESG payment area; and the remaining 22%, or 196 people, to the Alabama Balance of State ESG payment area within the Birmingham CoC. These calculations are necessary only in places where the CoC and ESG boundaries are in conflict. For example, the 390 homeless people in the Florence/Northwest Alabama CoC fall entirely within the ESG boundary for the Alabama Balance of State — a designation used for largely rural areas.
Adjusting very low-income renter counts to ESG geography
The remaining two variables of the CARES Act formula, measuring very low-income renters, come from a custom tabulation of American Community Survey data that HUD receives annually from the U.S. Census Bureau. The Comprehensive Housing Affordability Strategy data demonstrates the extent of housing problems and housing needs, particularly for low-income households nationwide. HUD calculates funding allocations using census data at the place-remainder level (Summary Level 070). The Howard Center used geographic information system (GIS) analysis to create custom shape files that corresponded to the place-remainder census geography. It then overlaid them with each year’s ESG map, using areal weighting to apportion the very low-income renter counts where an ESG boundary split a place-remainder area. Areal weighting is one of the simplest ways to interpolate demographic data across geographic boundaries that do not correspond with U.S. Census Bureau boundaries. It does not provide perfect results because it assumes demography is distributed evenly across a geographic region. However, it needed to be used on only about 4% of the country in 2020 and, on average, less than 4% over the last decade.
Adjusting all data by local fair-market rents
HUD adjusted each of the CARES Act formula variables to account for places with high housing costs by calculating a weighted national average rent for a one-bedroom apartment. It then considered how much that average differed from each location’s fair market rent and gave communities proportionately weighted increases in the formula. For example, a city whose fair market rent was 10% above the national average would have its total homeless count increased by 10%. Non-entitlement areas were not adjusted, regardless of housing costs. Increases were capped at 20% to lessen the impact of high-cost outliers. The Howard Center wrote a statistical modeling program to mimic HUD’s weighting of the data points.
Final calculation of new formula allocations
HUD summed each formula variable to get national totals, which were then used to calculate how much each of the 362 communities nationwide would get in emergency homeless aid.
Because the U.S. territories of American Samoa, Guam, the Northern Mariana Islands and the Virgin Islands do not all have annual homeless counts or data on very low-income renter counts, HUD set aside 0.2% of the funding and allocated it to these four areas by population.
The following formula shows the final calculation to determine the amount each ESG area receives:
The total allocation amount X:
[ 0.5 (area’s adjusted count of total homeless ÷ national sum of adjusted total homeless counts)
+ 0.1 (area’s adjusted count of unsheltered homeless ÷ national sum of adjusted unsheltered homeless counts)
+ 0.15 (area’s adjusted count of very low-income renters ÷ national sum of adjusted very low-income renters)
+ 0.25 (area’s adjusted count of very low-income renters living in overcrowded conditions or without full kitchen and plumbing ÷ national sum of adjusted very low-income renters overcrowded or without full kitchen and plumbing) ]
Limitations of the Howard Center’s analysis
There may be minor differences in the GIS analysis or the fair market rent adjustments that the Howard Center used compared to HUD. However, the vast majority of the Howard Center’s calculations (86%) were less than 2 percentage points off of HUD’s allocations for the second round of ESG funding in the CARES Act.
The Howard Center consulted a half-dozen formula funding experts at HUD and demographic researchers at Boston University and the University of Washington in conducting its analysis. Among the experts was Todd Richardson, an economist who heads the HUD research division that devised the new CARES Act homeless aid formula.
Responding to the Howard Center’s findings on how the CARES Act formula would have changed homeless funding amounts if applied over the last decade, Richardson said, “From a 10,000-foot level, these results are about what I would expect.”