Methodology
Comparing state-reported data to annual flaring volumes recorded by satellite
By Isaac Stone SimonelliHoward Center for Investigative Journalism
Climate change has been described as an “existential” crisis, and world leaders have made ambitious pledges to cut greenhouse gas emissions as they battle the crisis. But calculating a global strategy depends on good data and, so far, government leaders have been largely reliant on the oil and gas industry to accurately disclose the volumes it releases into the atmosphere.
The Howard Center for Investigative Journalism sought to check those reported volumes against recorded satellite data for areas of the United States where the oil and gas industry routinely releases large amounts of carbon dioxide and methane, two of the most powerful greenhouse gases.
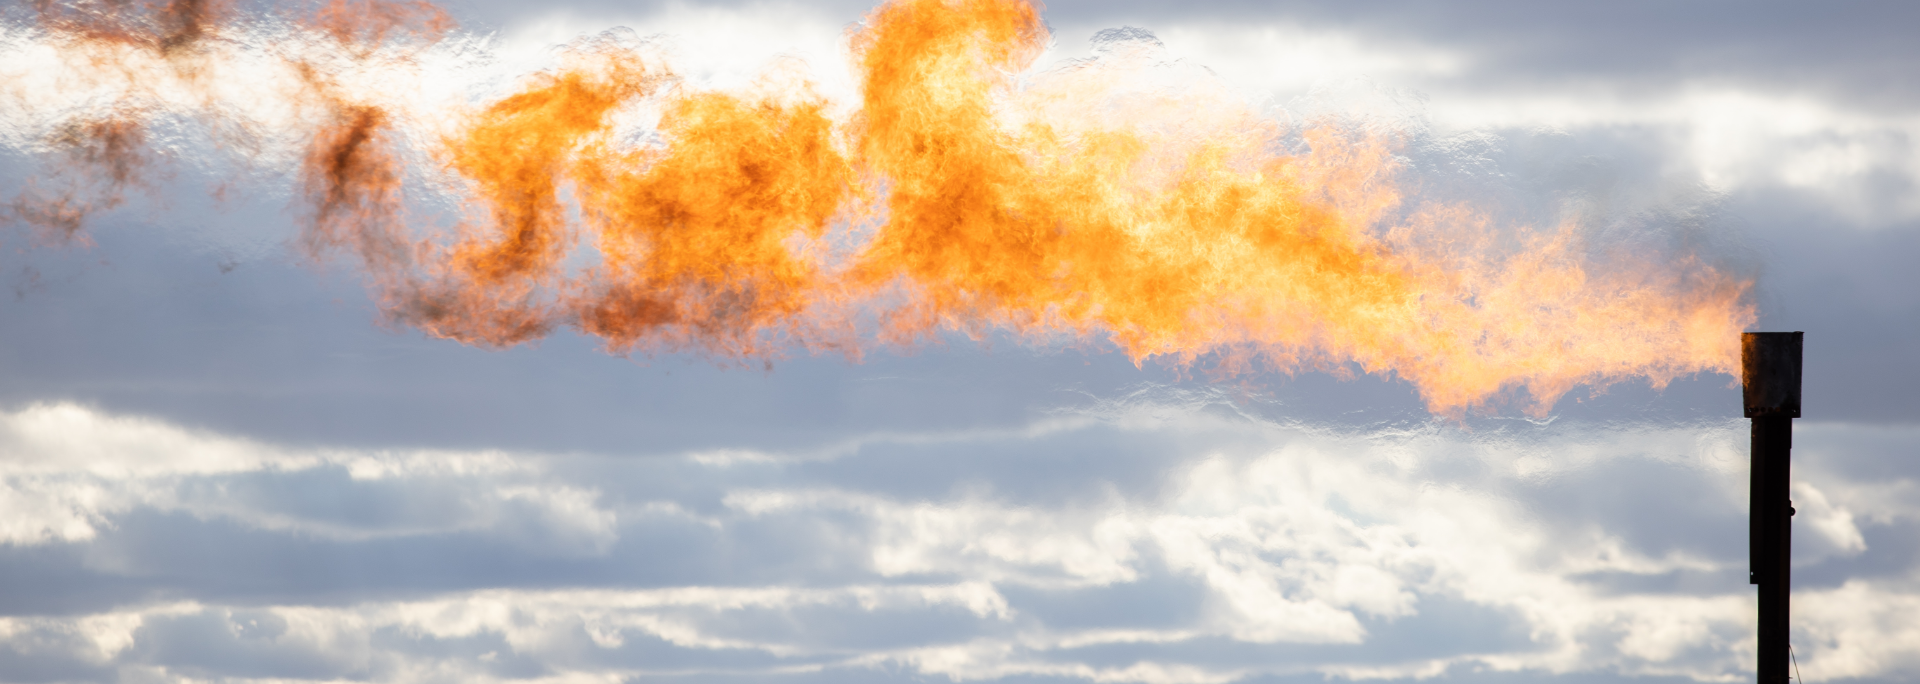
These emissions occur when natural gas is burned off or simply released into the atmosphere during oil and gas production, respectively known as flaring and venting. Environmentalists and scientists agree that cutting flaring and venting is one of the easiest ways to rein in greenhouse gas emissions and help slow the speed of global warming.
The Howard Center focused its investigation on 13 states identified by the U.S. Department of Energy as having “significant ongoing and increasing flaring activity” or “a possibility that a combination of rapid oil play development and regional pipeline capacity constraints could lead to pressure to increase natural gas flaring.”
Texas and North Dakota were the DOE’s two Category I states. Category II states included New Mexico, Wyoming, Alaska, Louisiana, Colorado, Montana, Utah, Oklahoma, Pennsylvania, West Virginia and Kansas.
Howard Center reporters contacted the relevant agencies in each state to gather the data that oil and gas companies were required to report and calculated annual totals. They then plotted the satellite data to their corresponding states based on latitude-longitude coordinates, allowing them to compare flaring volumes recorded by the satellite with volumes reported to the states.
Eyes in the sky
In 2015, Christopher Elvidge, a National Oceanic and Atmospheric Administration scientist, published a paper detailing how he and his research team were able to determine global flaring volumes using Visible Infrared Imaging Radiometer Suite (VIIRS) instruments aboard satellites to measure near-infrared and short-wave, mid-wave and long-wave infrared light. At night, VIIRS measures three wavelengths of light that show up only for combustion sources, such as the burning of natural gas, eliminating urban and other light sources.
A filtering process uses several algorithms to remove infrared signals from biomass burning events, such as forest fires and flares associated with landfills and coal mines, as well as to deal with nighttime cloud cover obstructing the observation of flares.
A temperature and radiant heat is determined using Planck’s law of thermal radiation for each infrared light source identified by the VIIRS satellite. The total annual radiation from the selected sources is then converted to volumes of natural gas burned using a calibration system based on upstream flaring data from 47 countries.
Almost all of the flaring captured by satellite occurs at upstream locations, such as extraction and production sites. A small amount comes from midstream flaring, which occurs after gas leaves extraction sites and before it arrives at a refinery. Based on the advice of experts and available state data, the Howard Center focused its analysis on flaring and venting at upstream sources.
The VIIRS database records flaring volumes in BCM, or billion cubic meters, while all states report their flaring and venting volumes in MCF, or thousand cubic feet. The Howard Center converted VIIRS data from BCM to MCF before making the comparisons.
Elvidge, now the director of the Earth Observation Group at the Colorado School of Mines, and his team conduct a manual check of any burning events caught by the satellite that might not be associated with oil and gas development. But he acknowledges the potential for such points to slip through the cracks. During the Howard Center’s investigation, for example, reporters discovered that one of the larger sources of flaring detected by satellite in Colorado for 2019 and 2020 appeared to be a landfill flare, based on a close examination of images on Google Maps. The flare did not show up in earlier years of satellite data, but experts said the large flare could increase the margin of error for Colorado.
Jennifer Miskimins, the head of the petroleum engineering department at the Colorado School of Mines, oversaw a 2021 study that used VIIRS satellite technology to determine differences between satellite-observed flaring and state reported data in North Dakota. Gunnar Schade, an atmospheric scientist at Texas A&M University, oversaw a similar study in Texas in 2019.
Schade believes the current calibration system needs to be reworked to more accurately measure flaring volumes. Elvidge says his team is in the process of doing that, but the new calibration system has yet to be released and applied to the VIIRS data.
Blind spots
While the satellite data offers new insights into the amount of natural gas being flared, it has limitations.
The most significant is that the satellite technology is unable to observe venting — the release of uncombusted natural gas, which is mostly methane. This proved problematic when comparing satellite totals against data from states that report their flaring and venting as a combined volume. Nonetheless, in some of those states, the flaring volumes observed by satellites were greater than the combined totals reported to regulators.
Intermittent flaring can also increase the chance that satellite data does not accurately capture the volume of flared natural gas. There are currently two VIIRS-equipped satellites providing data for Elvidge’s work. As they pass over Earth’s surface, the instruments are able to observe a flare’s combustion for just a fraction of a second. If a flare is unlit at the exact moment the satellite passes overhead, no data will be recorded. Conversely, if the flare is lit, researchers assume it will remain lit for a 24-hour period. Elvidge said he believed such under- and overestimations are balanced out when using annual data.
Anything that impacts the amount of heat being released by a flare can also impact satellite measurements. For example, small flares burning below a certain heat threshold are missed by satellite observations. Elvidge said there are more small and intermittent flares in the United States than other countries.
The technology’s inability to capture combustion during the day is also a limitation. This is particularly relevant to oil and gas production above the Arctic Circle in Alaska, where there are months of constant daylight.
Given the various limitations, Elvidge estimated the margin of error for measuring flared gas volumes via satellite at plus or minus 9.5%.
Eyes on the ground
Most of the 13 states had their own, unique system for tracking and reporting natural gas that is flared or vented by industry, but the reporting requirements varied widely. For example, seven states reported flaring and venting amounts as combined volumes. Not knowing how much gas is vented handicaps regulators because vented gas, which is mostly methane, has a greater impact on global warming in the short term than carbon dioxide, the primary byproduct of flaring.
Sifting through relevant rules, regulations and conducting dozens of interviews, the Howard Center determined that not every state required all flaring and venting to be reported. In some states, flaring and venting volumes that fall below a set threshold do not have to be reported; in others, producers need only estimate their volumes.
Reporters reached out to regulators in each state to obtain data on volumes of flared and vented natural gas at oil and gas production sites. Because there are no federal requirements that establish a uniformity for how flaring and venting data is collected at the state level, reporters received a patchwork of data that varied significantly from state to state.
For example, Texas and North Dakota – the two largest flaring states – track those volumes differently. Texas regulators allowed operators to combine their flaring and venting volumes for years until the rules changed in September 2021. In North Dakota, regulators track flaring volumes but generally prohibit venting. They also track monthly oil and gas production, including well sites’ latitudes and longitudes, unique identification numbers, operators’ names, and the amount of natural gas sold or flared.
Other states require much more limited reporting by oil and gas companies. Oklahoma had no database of estimated flaring and venting volumes, so the Howard Center built one by extracting information from more than 800 permits submitted to the Oklahoma Corporation Commission between 2012 and 2020.
Reporters were unable to do the same for Kansas, for which satellite data showed about 2 billion cubic feet of flared gas. In response to a public records request for flaring or venting data from 2012 to 2021, the Conservation Division of the Kansas Corporation Commission provided what appeared to be partial records for some of the years and nothing for 2017 and 2018.
Neither Pennsylvania nor West Virginia kept flaring volume data. Instead, both states keep only emissions data, which catalogs various pollutants and cannot be compared to the satellite data.
The Howard Center compared what companies reported to regulators in each of the 13 DOE-designated states against annual VIIRS satellite data from when it first became available on March 1, 2012, through 2020. For Wyoming and New Mexico, company reports were available starting only in 2014.
Reporters also checked data from the U.S. Energy Information Administration, which says its data is either estimated, gathered via “good-faith” outreach to state agencies or collected from flaring data publicly available on state agency sites. The numbers published by the EIA did not match the state-reported totals calculated by the Howard Center or the flaring volumes recorded by satellite.
An agency spokesperson said the EIA recognized “the importance of having accurate national and state-level data” and was investigating ways to improve data collection, including the possible use of satellites.
For a fuller explanation of how data was gathered and analyzed by reporters, see the state-specific GitHub link.